

Powerful and unique functionalities
Software to trasform data into PowerPoint chart
Create meaningful stories in few seconds.
LINK DATA BY COPY AND PASTE
Link your data from different sources as easy as copy and paste. Connect to Excel, Access or use an embedded data table. Use cell ranges or name ranges.
ALL KIND OF CHARTS AND ARTS AVAILABLE
Huge template library available, including classic charts, rating charts, pictorial charts, gantt charts, agendas and SmartArts.
CUSTOMIZE QUICKLY TO YOUR NEEDS
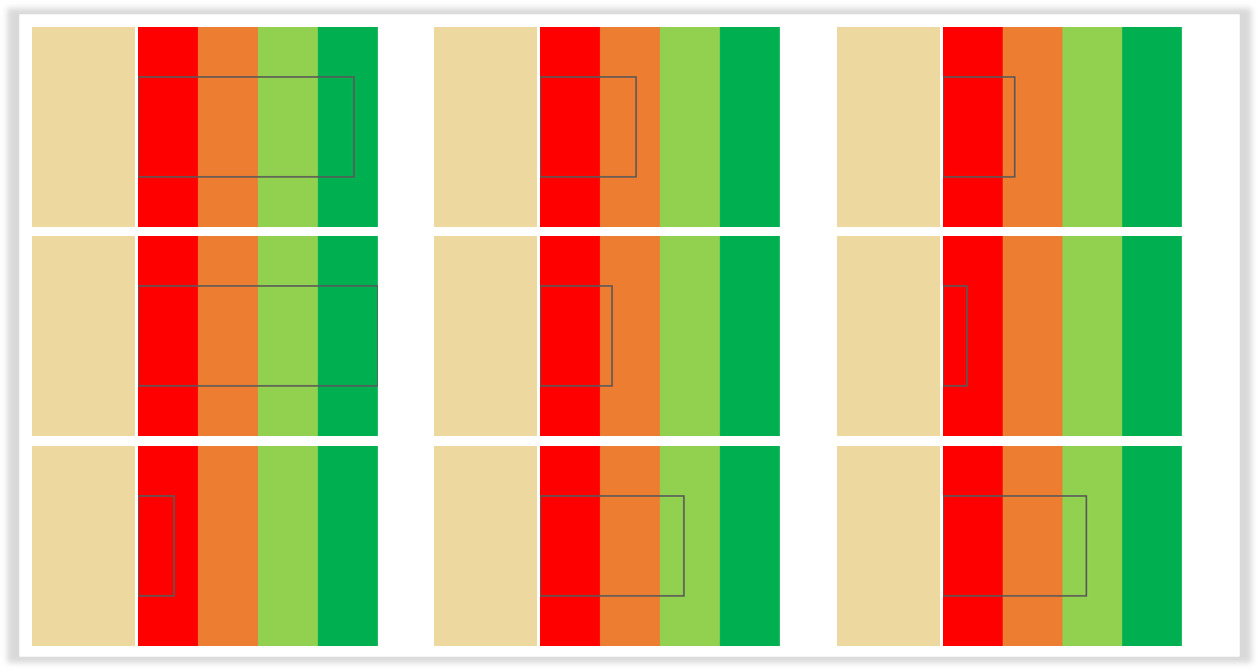
All charts can be fully customized, freely rearranged, objects shown or hidden, data filtered or split, shown vertical or horizontal, in classic or dashboard view.
CORPORATE BRANDING CREATING AND APPLYING THEMES
Create your own themes not only for graph colors but also for icons and pictures, comment fields and category titles.
HUGE ICONS LIBRARY
Stop searching the internet for the right icon. Choose from a vast variety in CHART | BI’s icon library, automatically applying the right colors from your themes.

EASY TO INSTALL
Just download and install – no admin rights required.
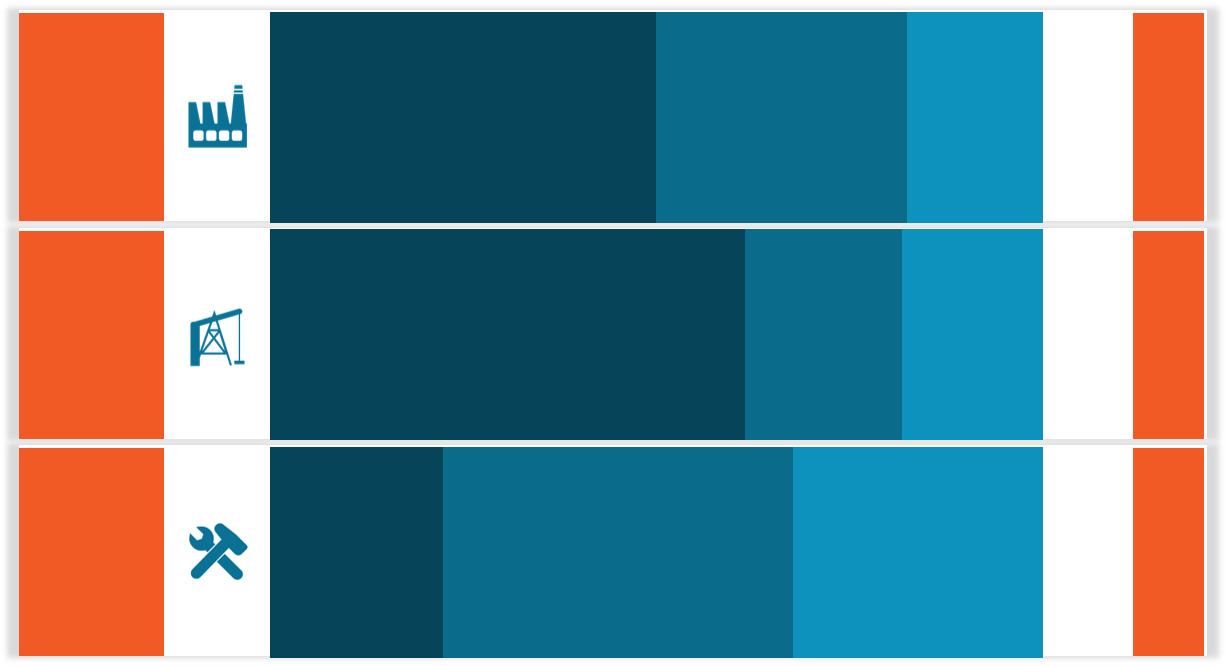
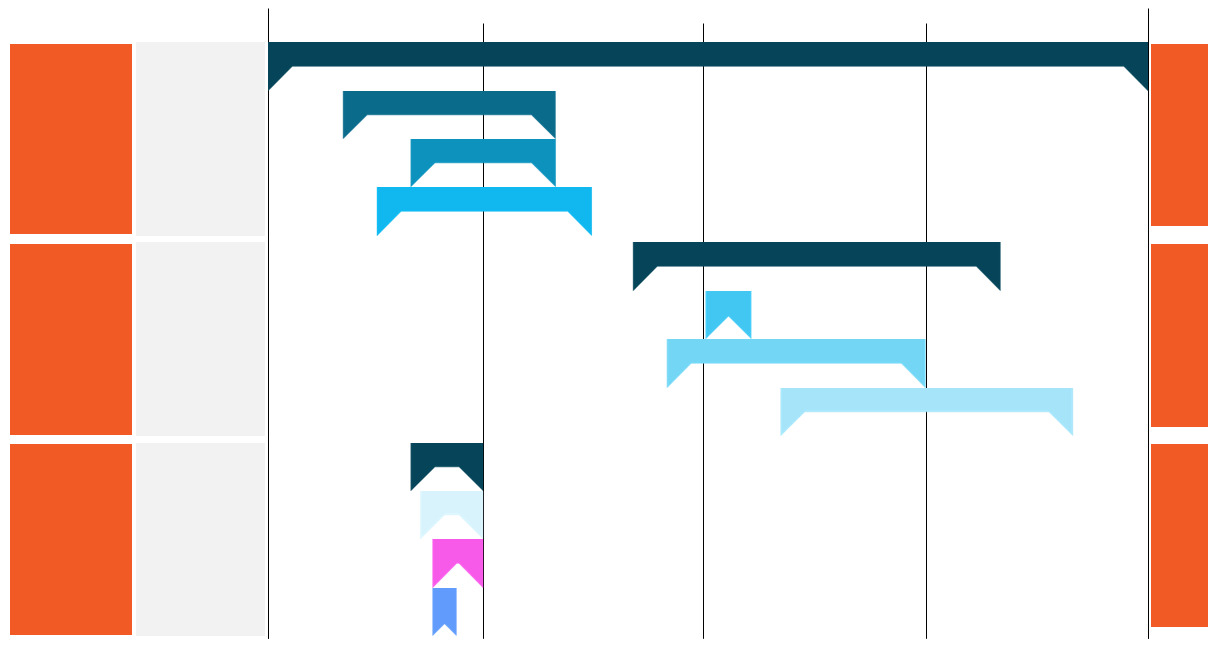
Charts Library
CHART | BI includes an amazing Charts Library with more than 50 charts categorized per type (Bar, Line, Gantt, etc) and per functional area (Strategy, Finance & Controlling, Sales, etc) to help you in trasforming your data into valuable insight.
CHART | BI is committed to continue developing new charts to enhance Business Data Visualization.
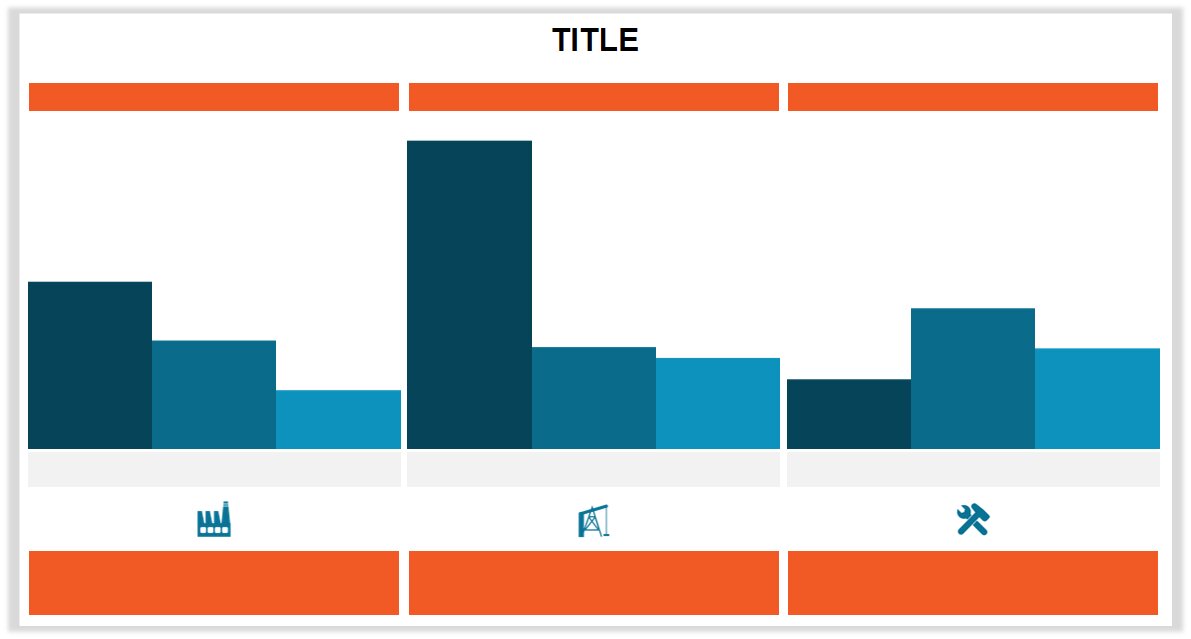
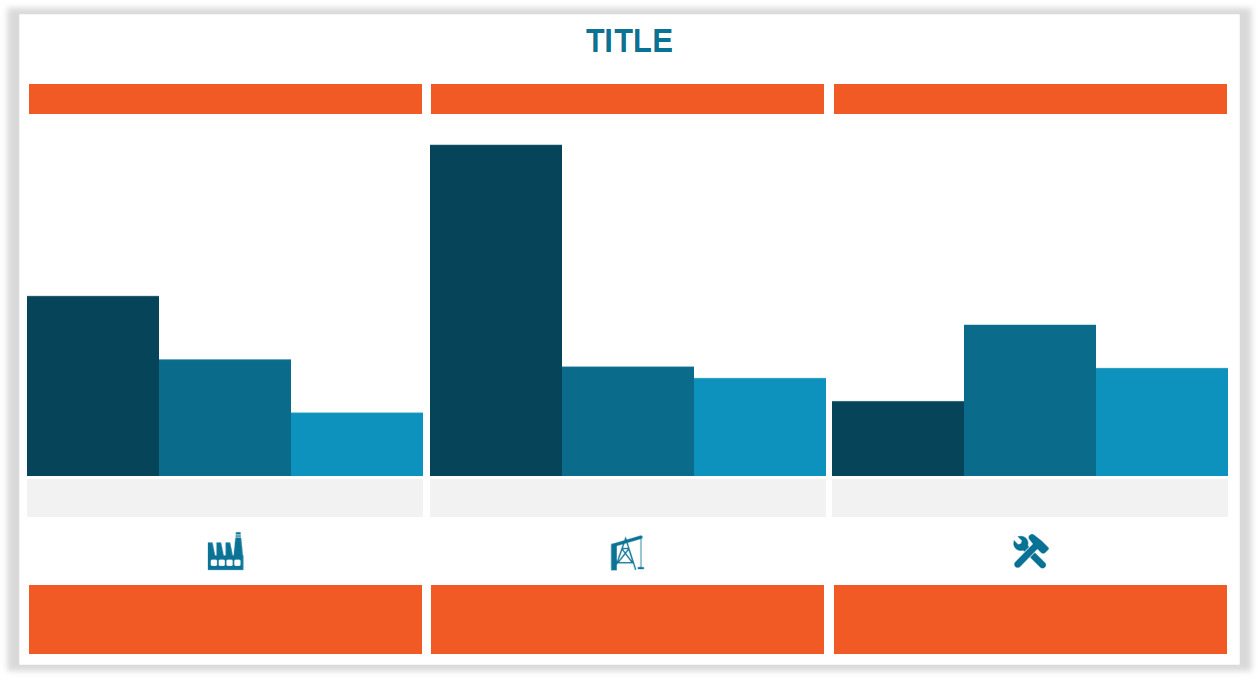
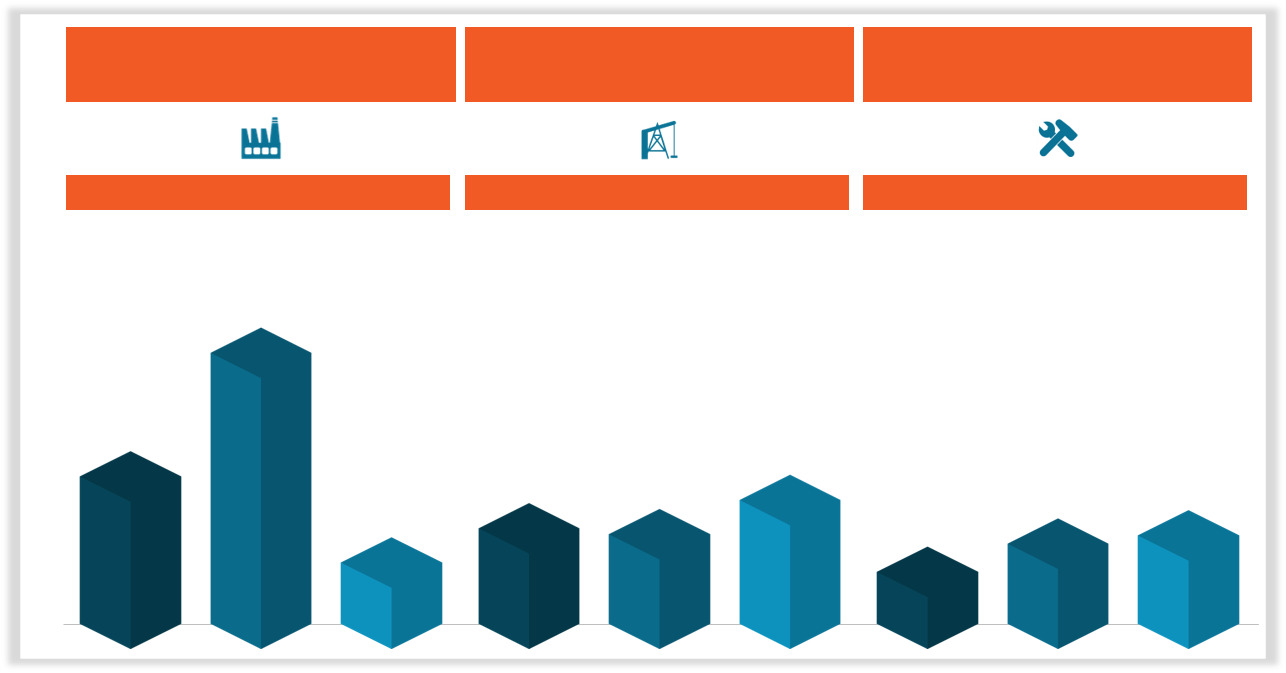
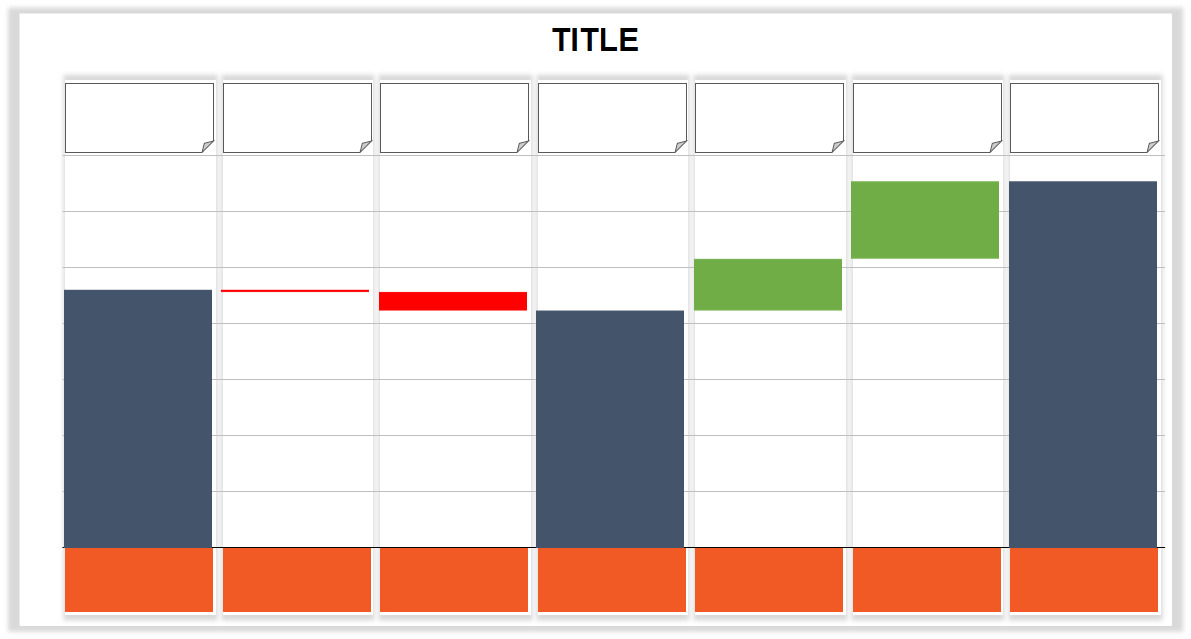
CLASSIC Charts
The Vertical and Horizontal Bar Charts represent and compare different values by using shapes plotted vertically and horizontally.
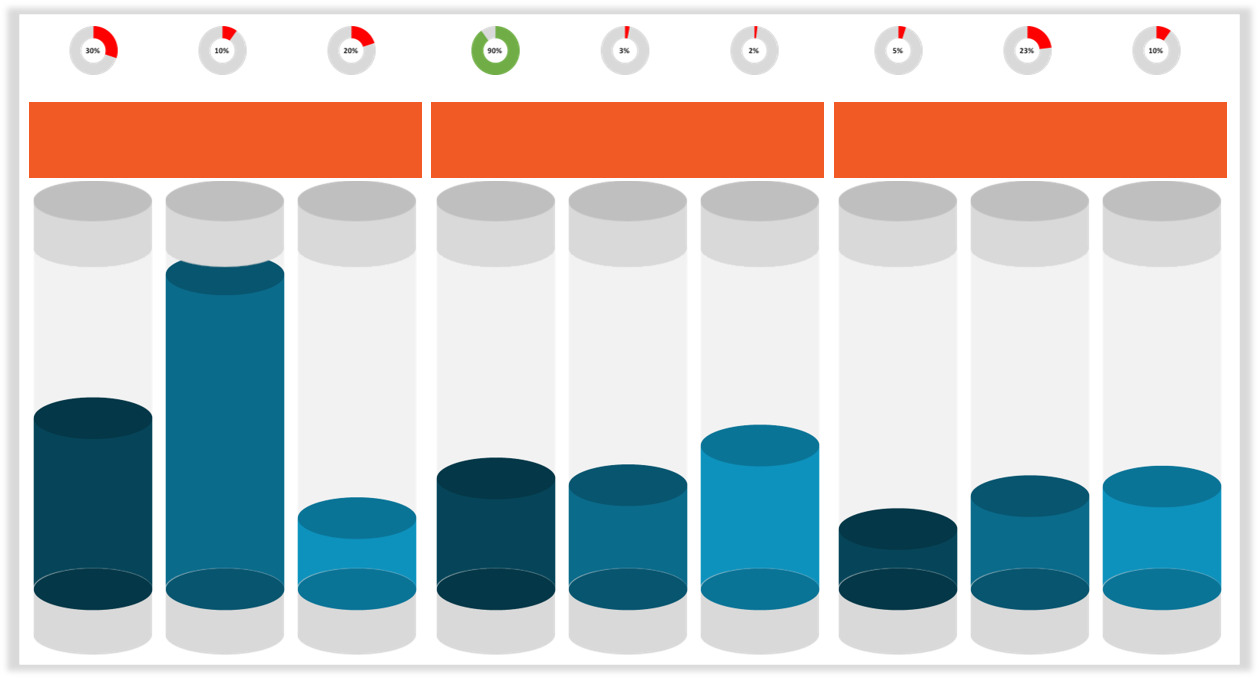
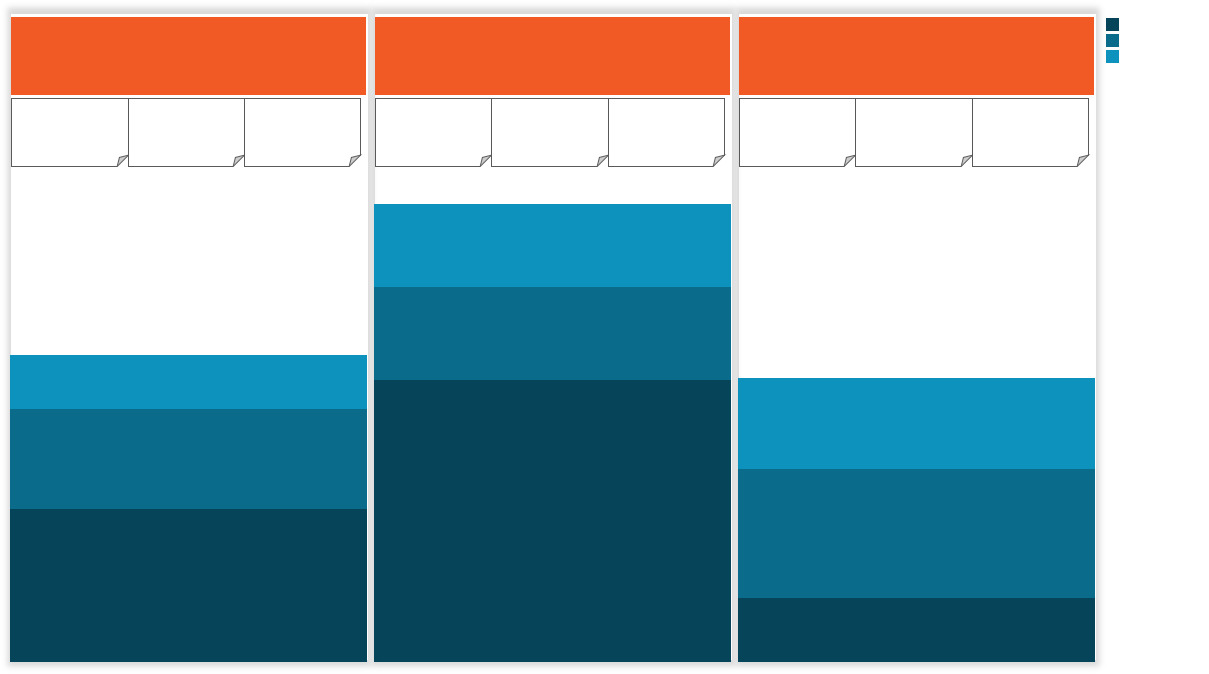
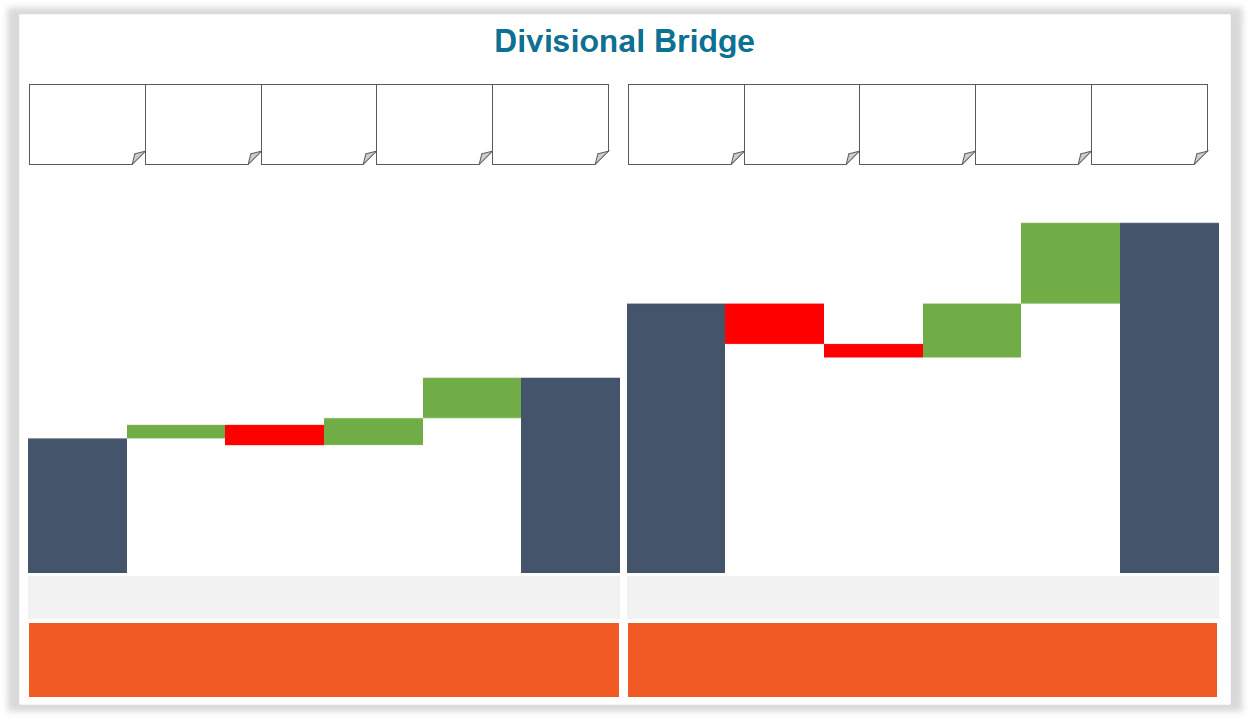
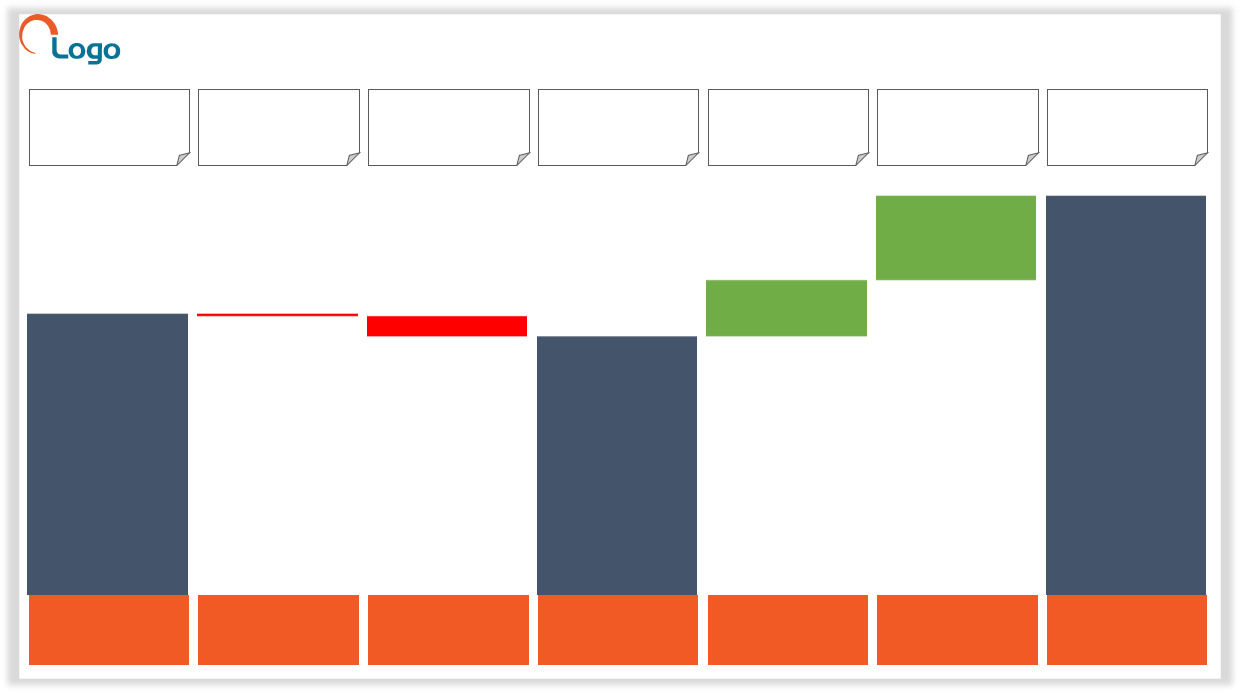
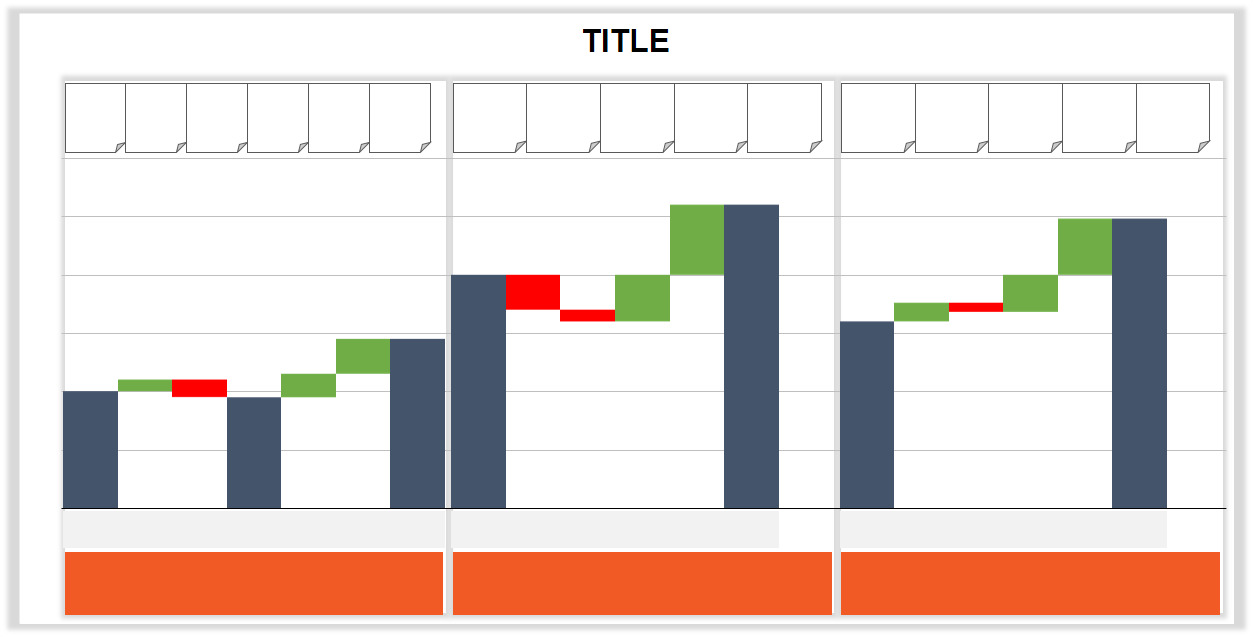
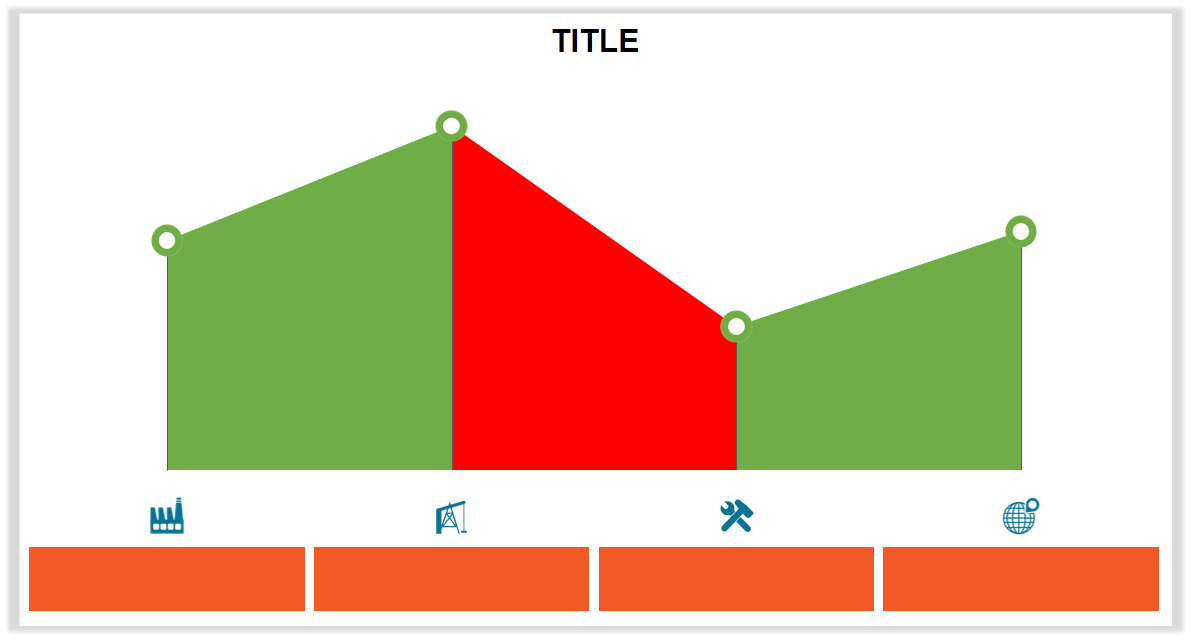
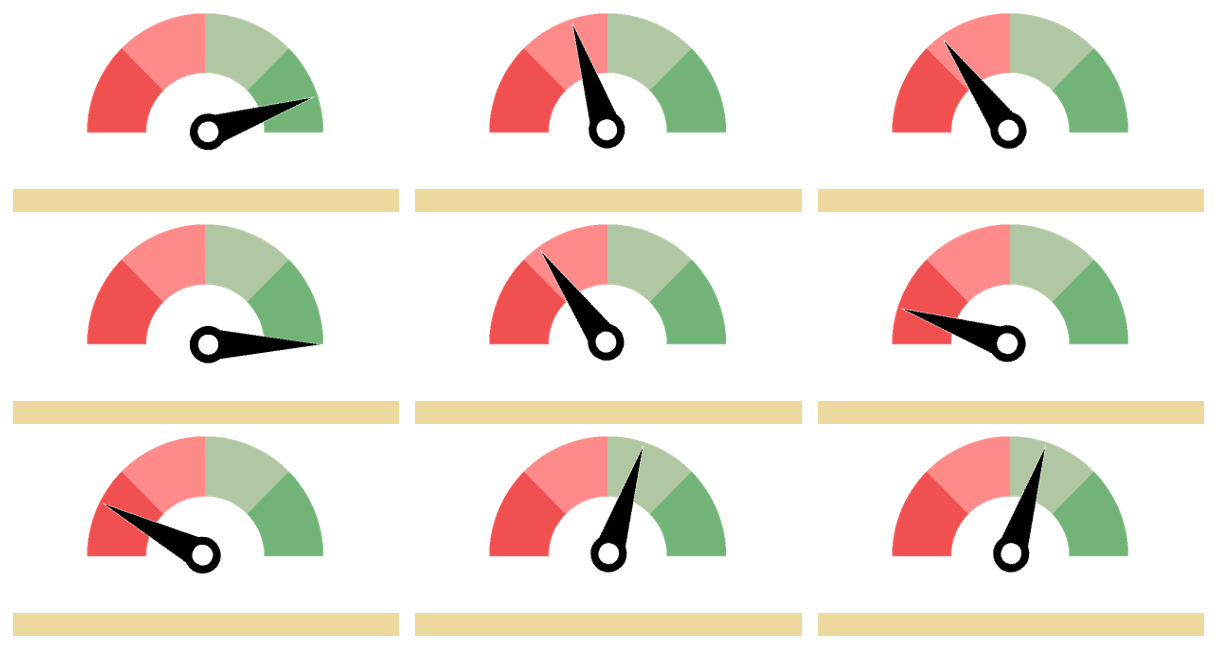
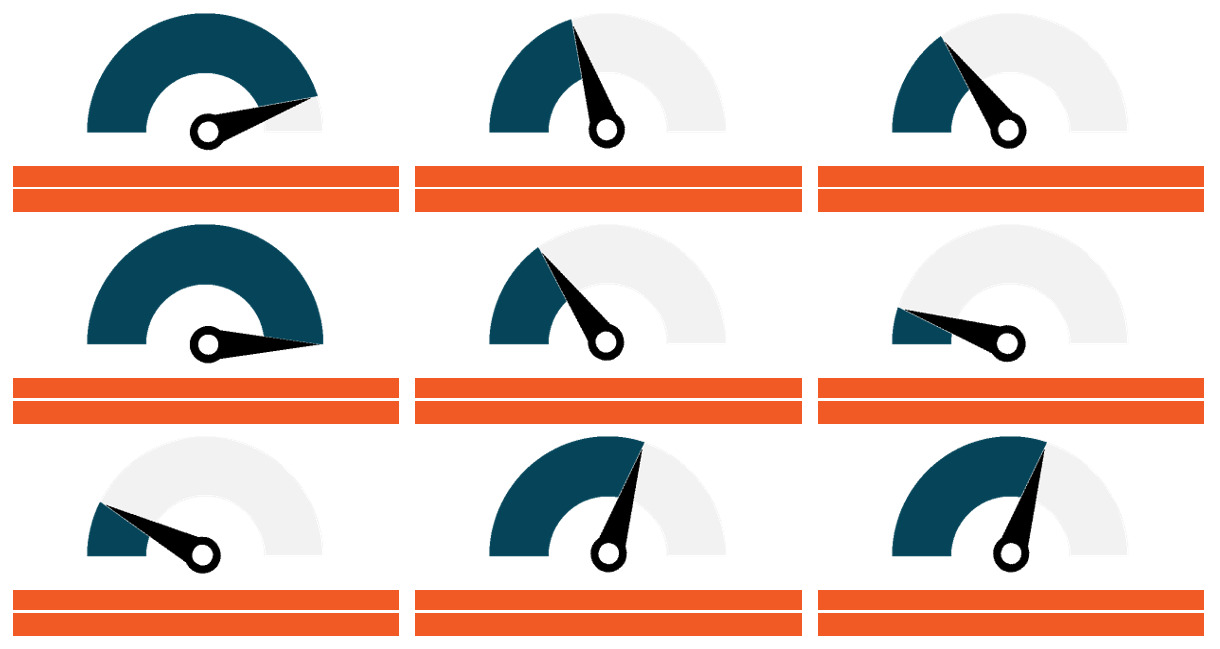
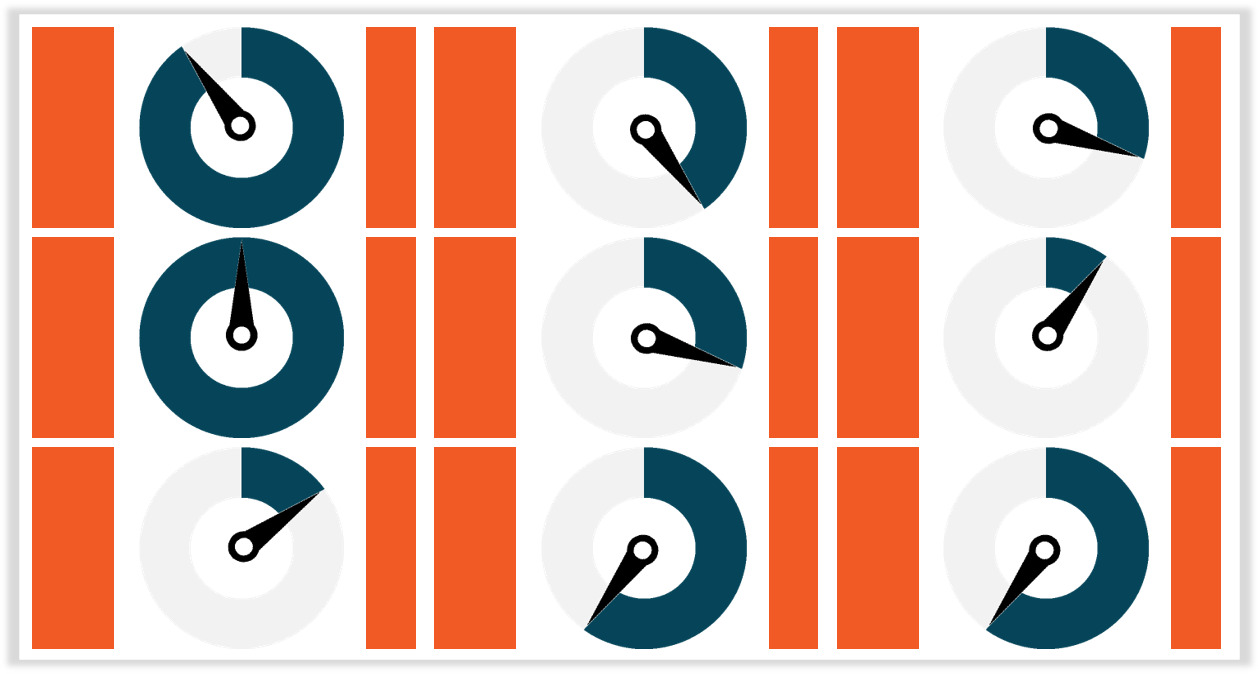
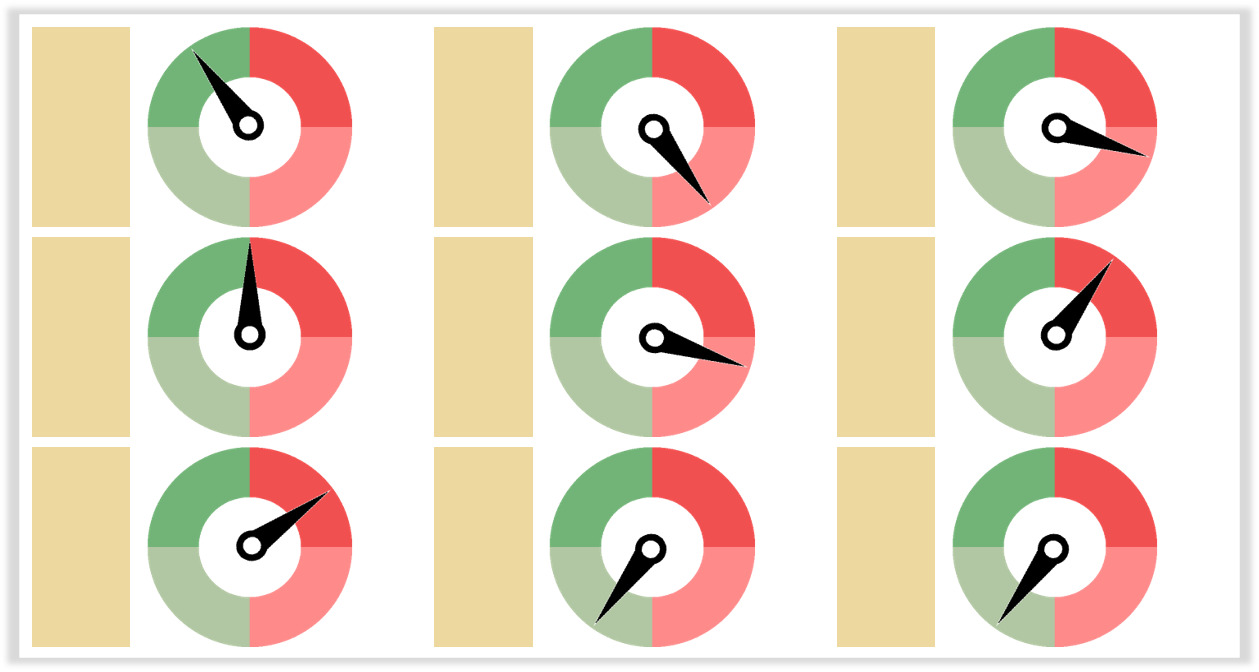
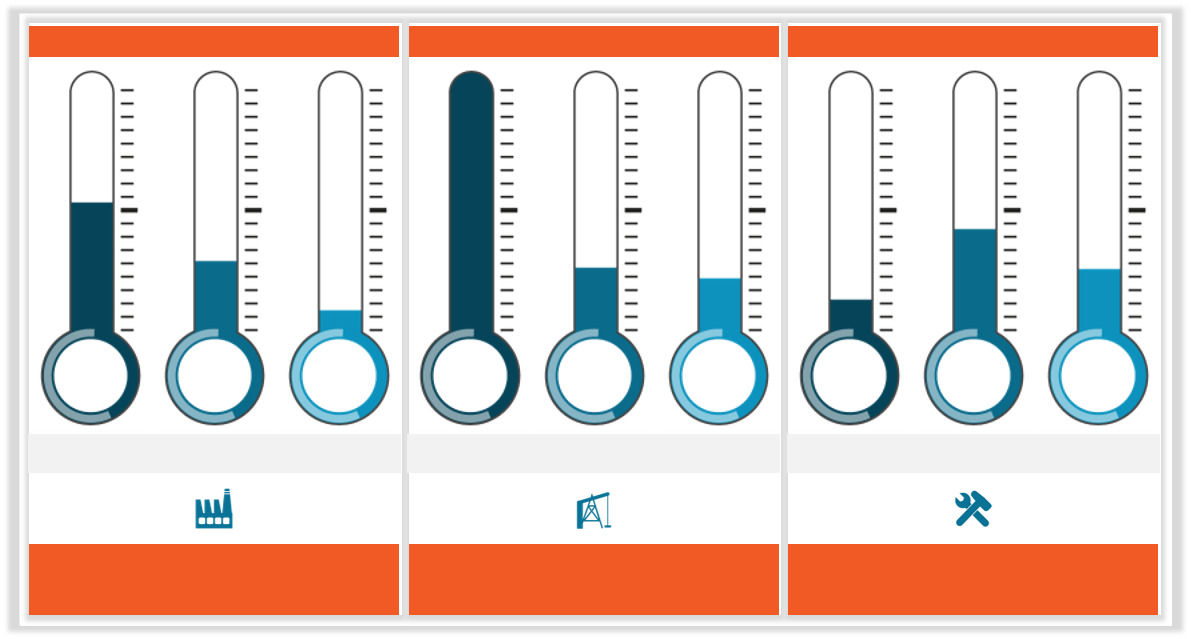
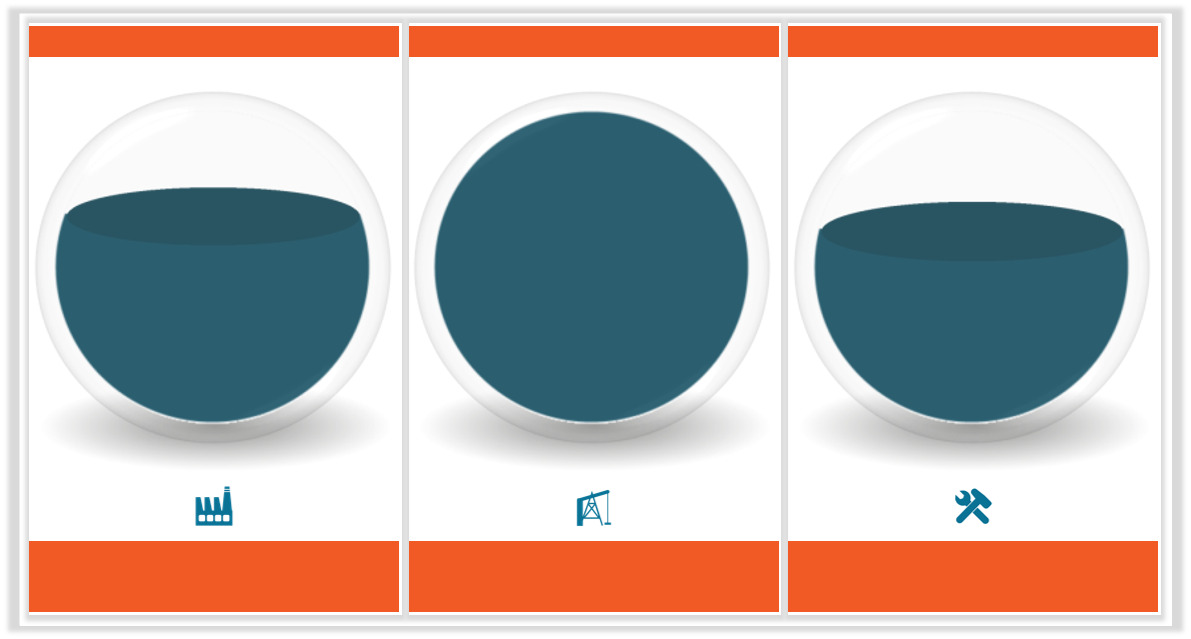
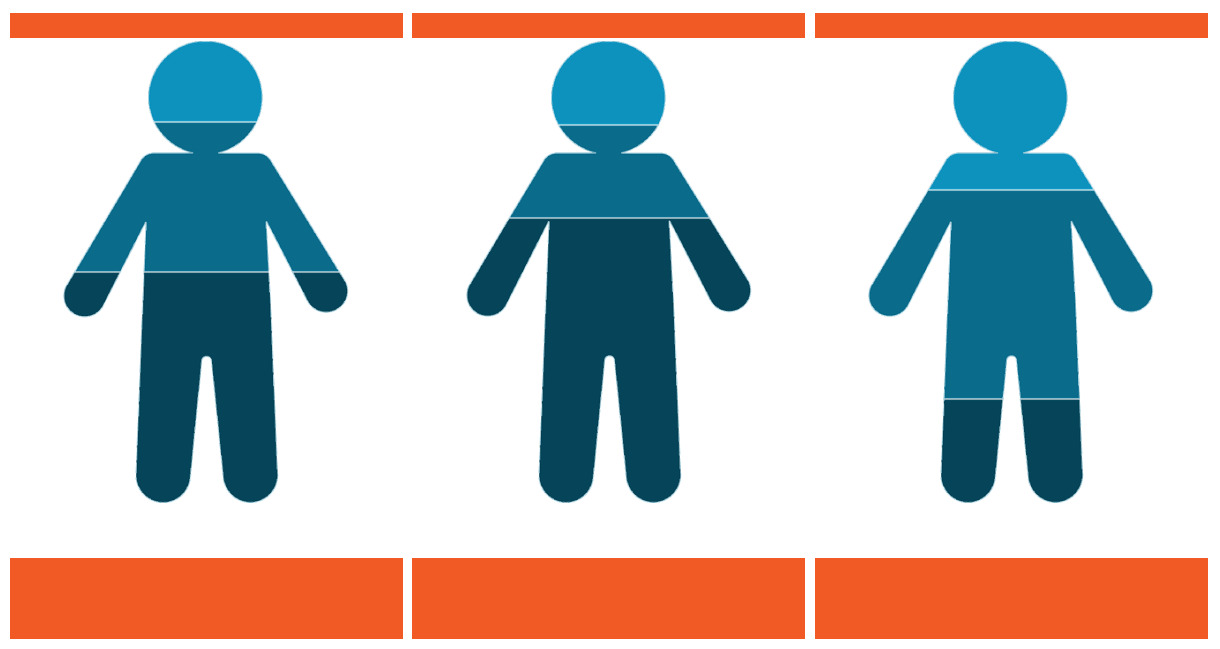
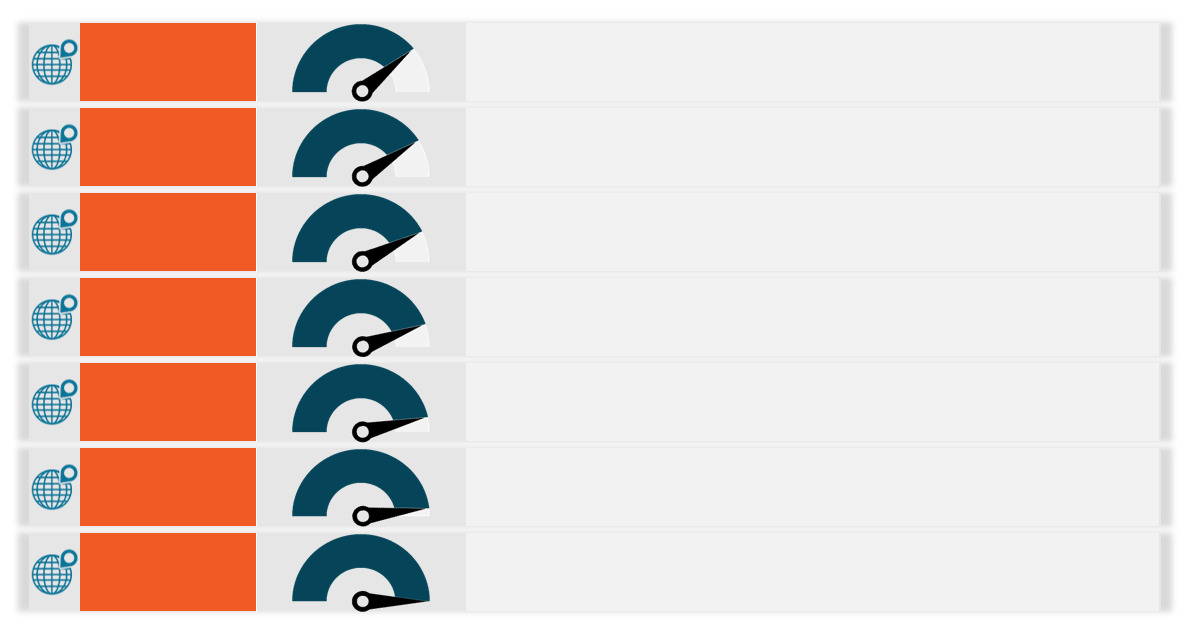
RATES Charts
Waterfall charts help in understanding the cumulative effect of sequentially introduced positive or negative values.
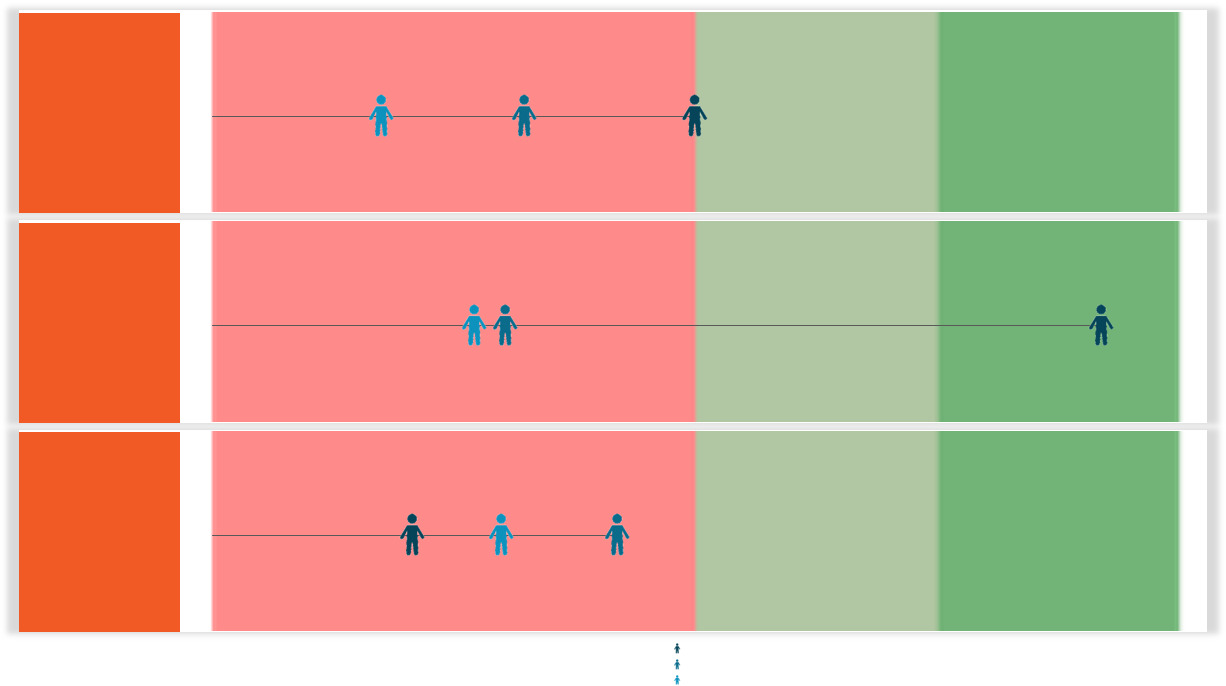
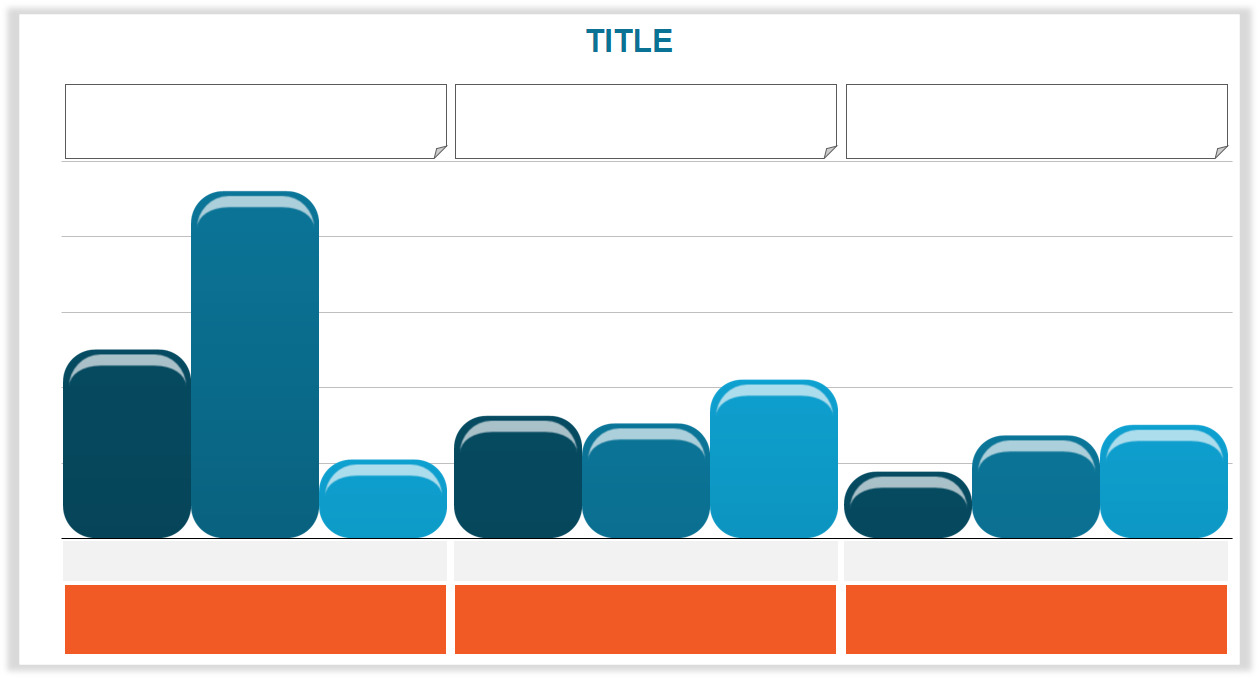
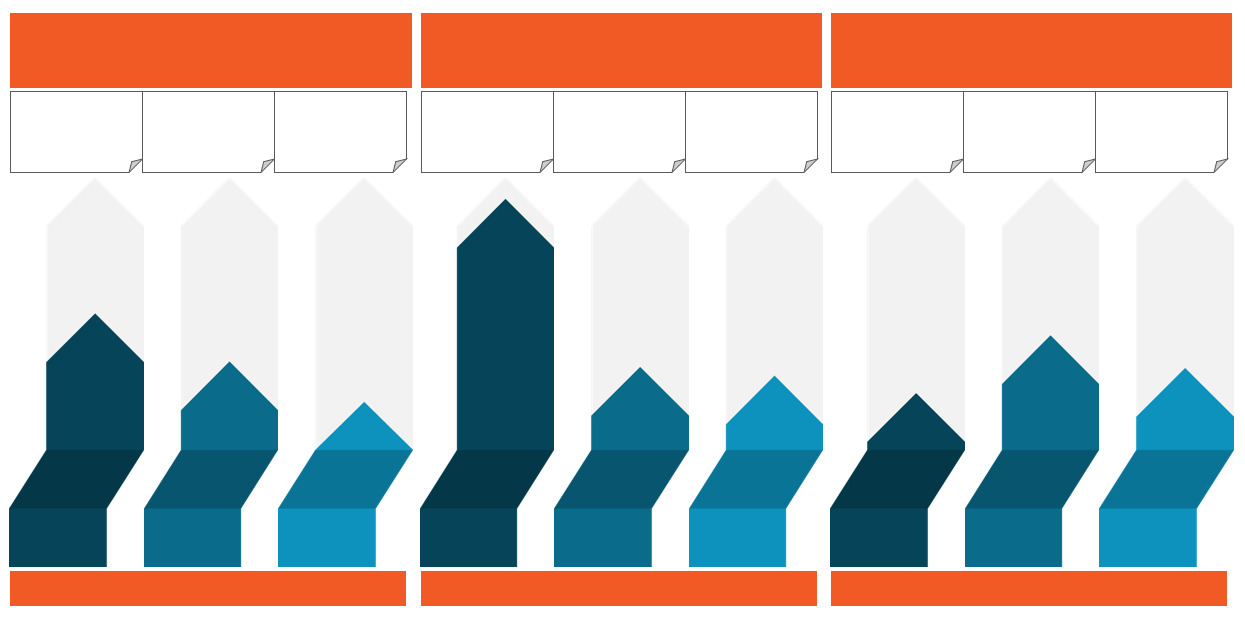
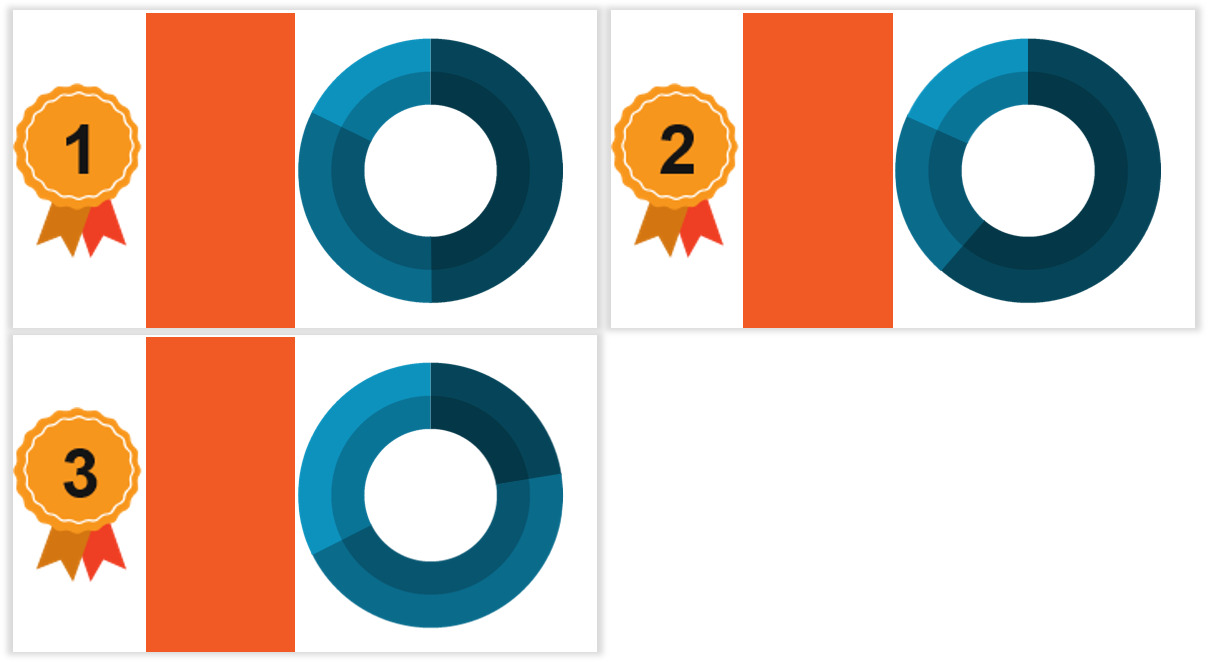
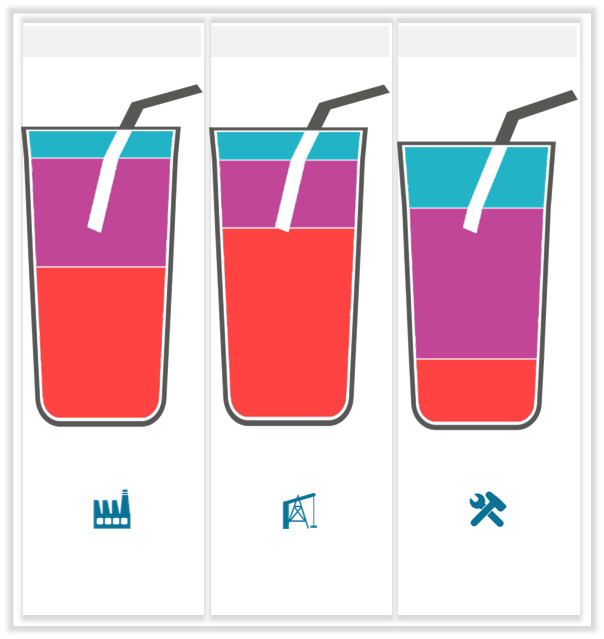
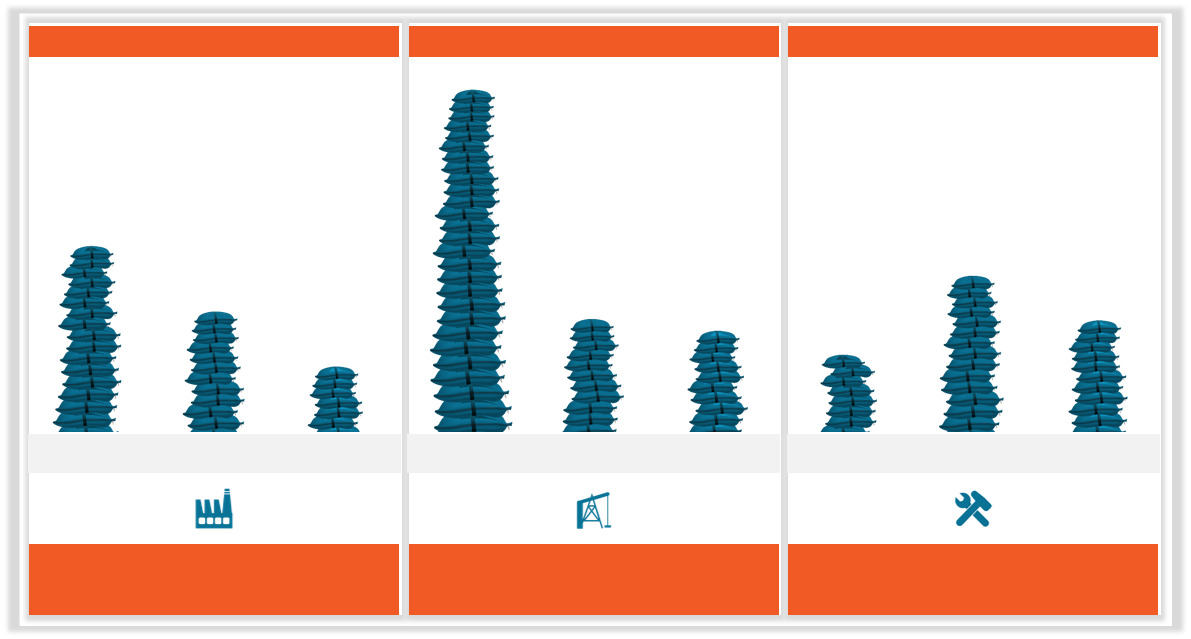
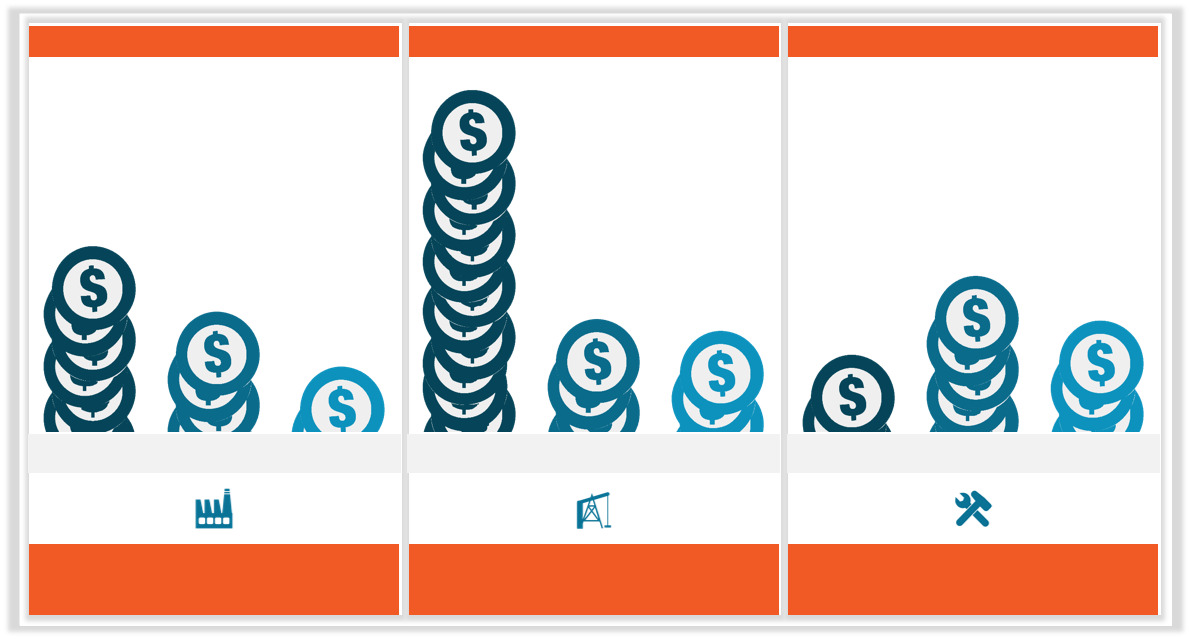
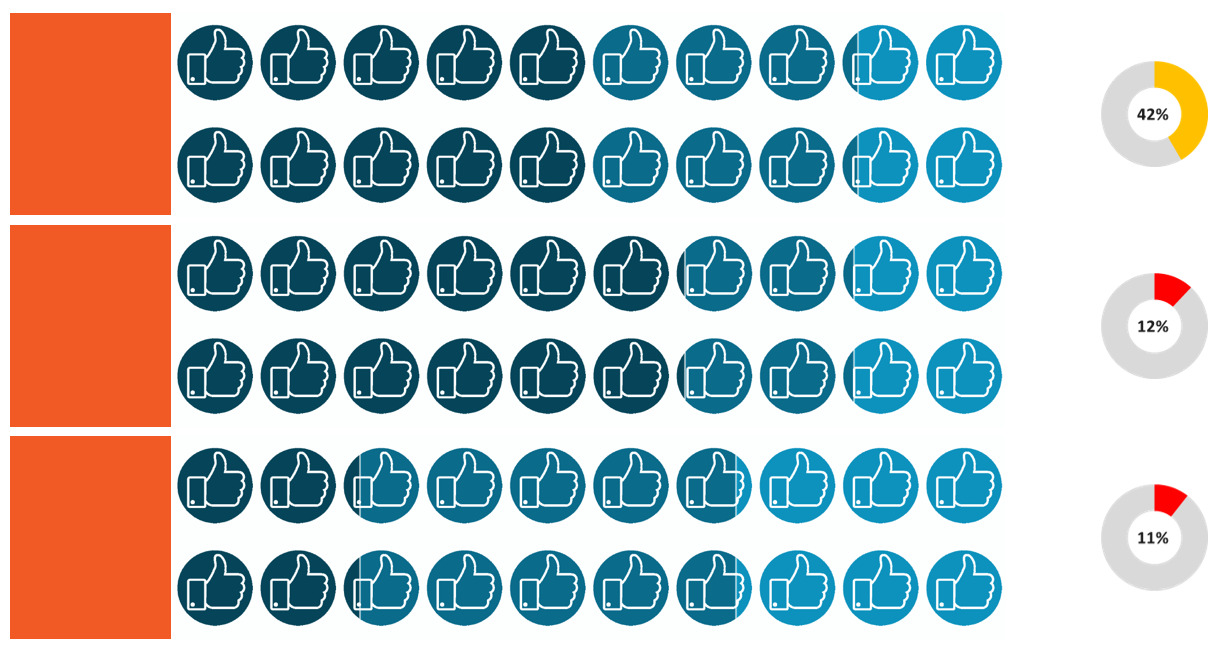
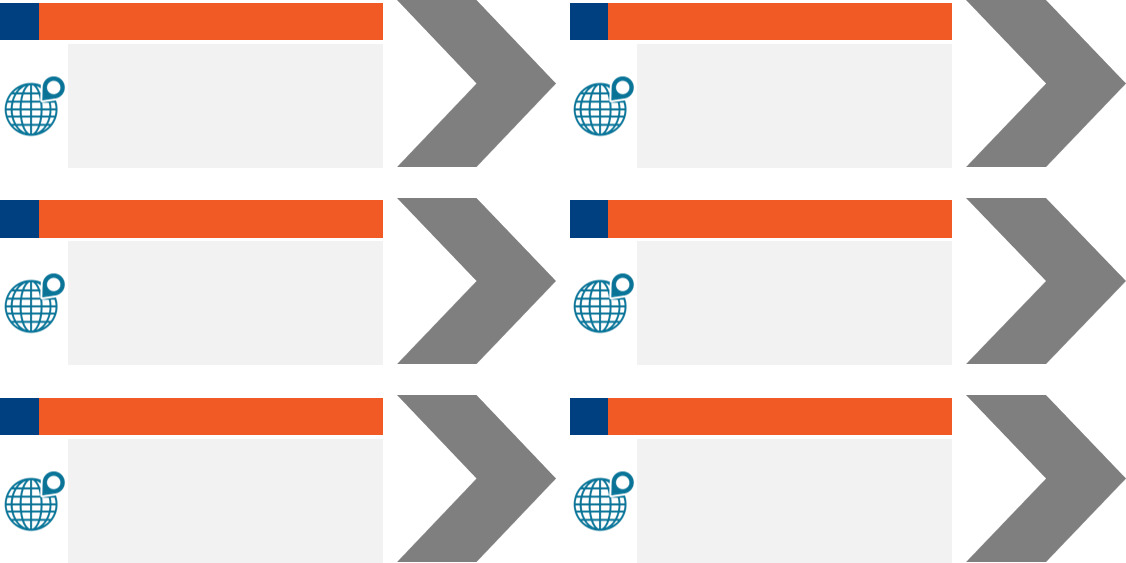
PICTORIALS Charts
Line Graphs display how values have changed during a time period by using a line which connects data points.
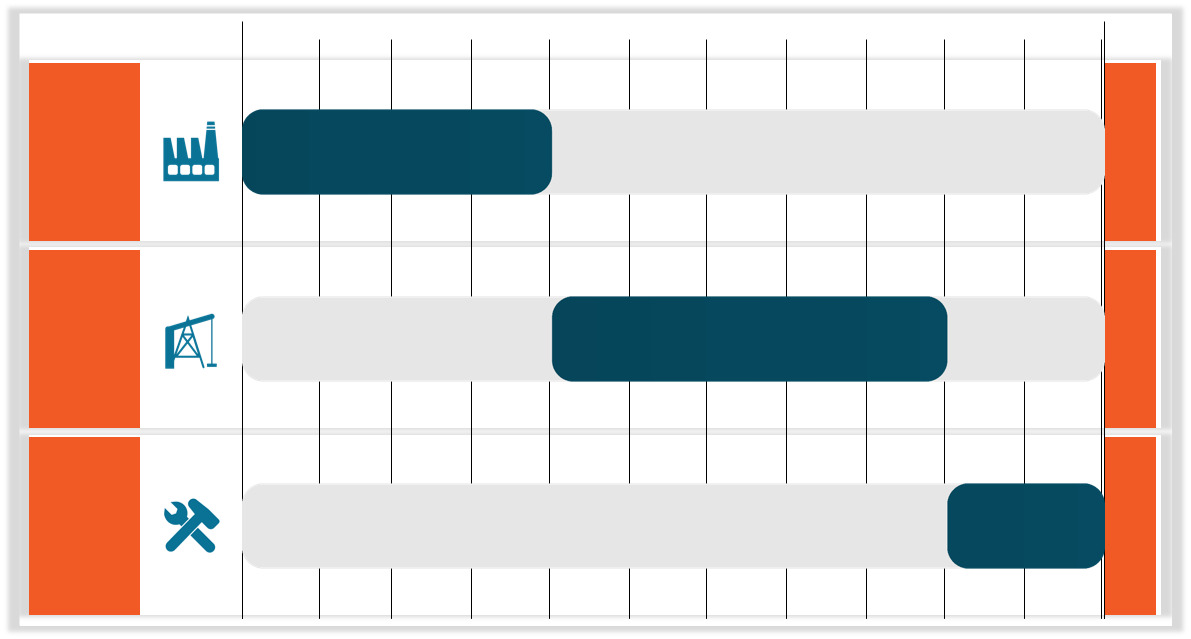
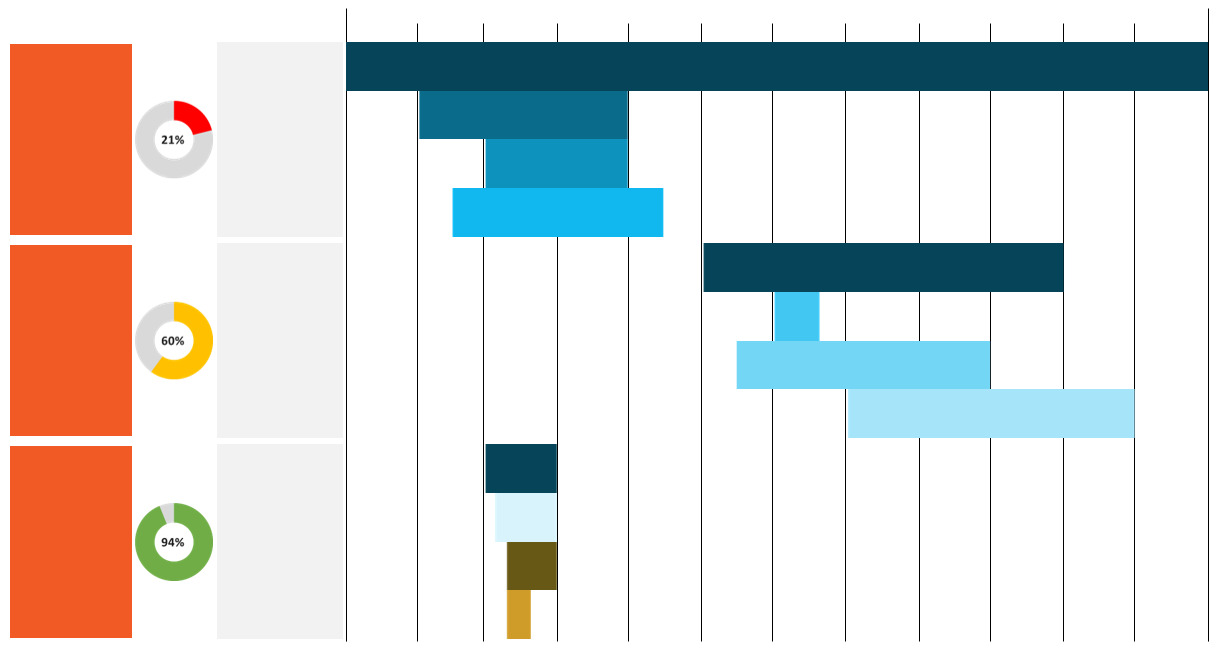
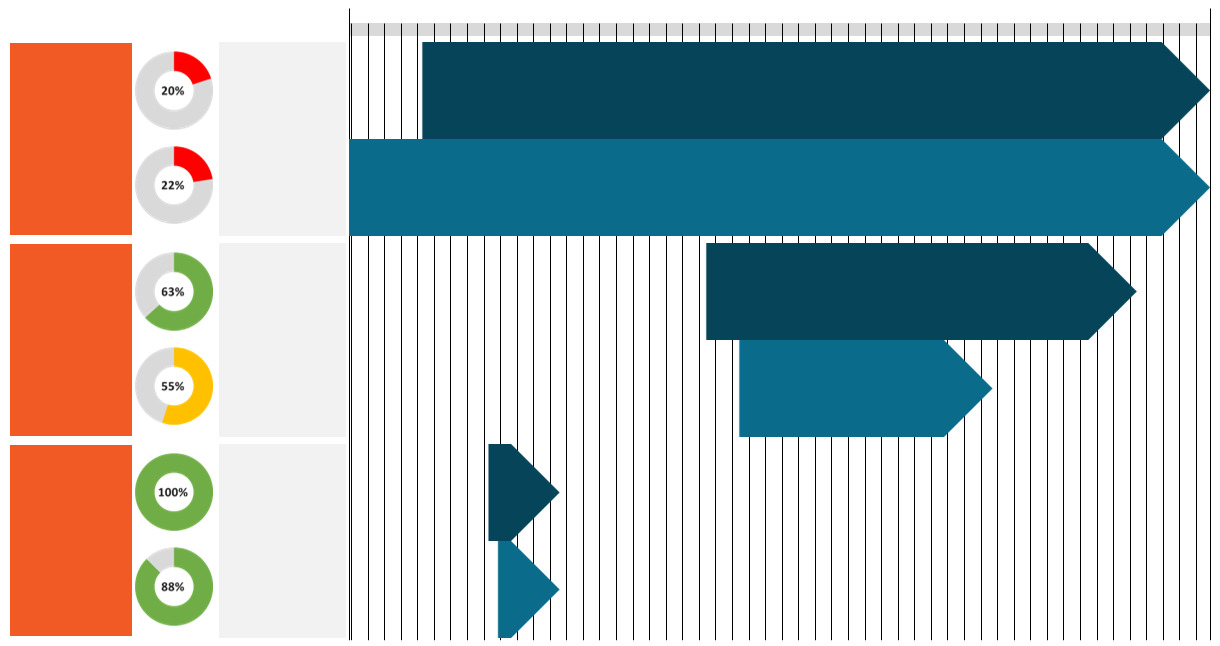
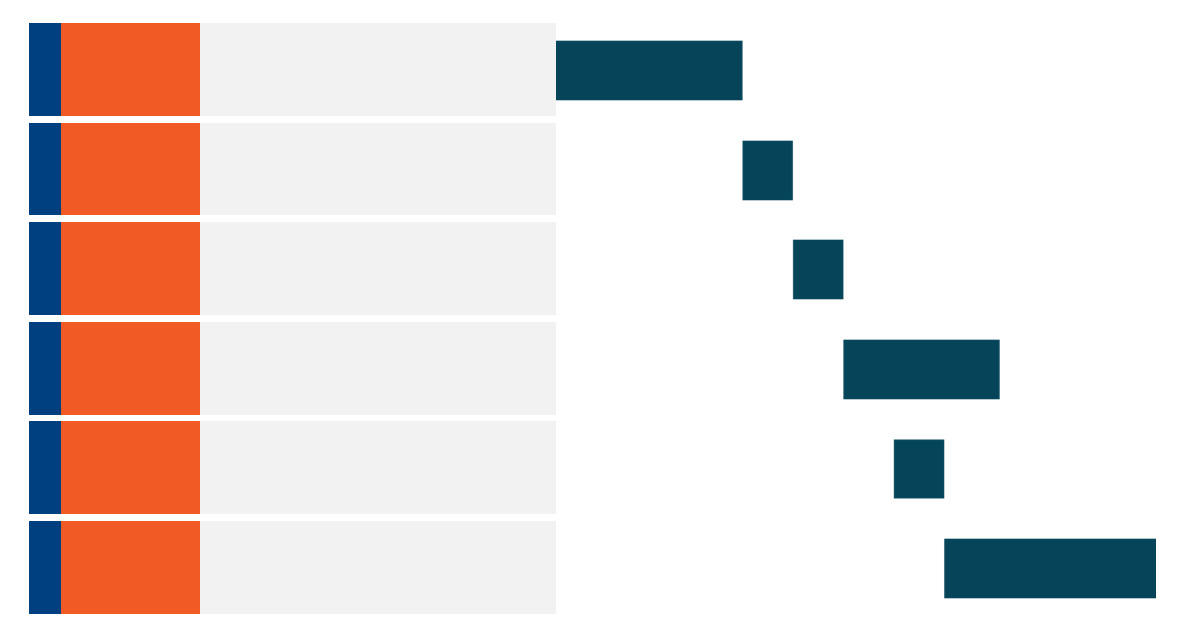
GANTT Charts
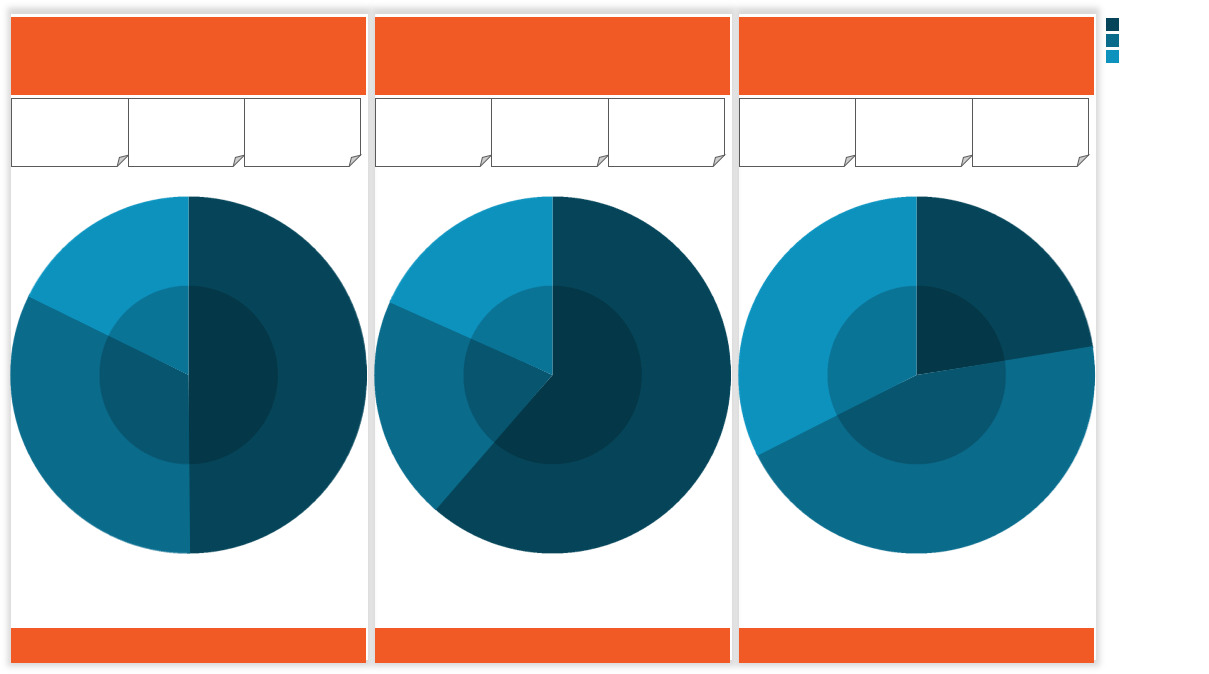
Donut and Pie Charts display proportions and percentages between categories, by dividing a circle or a ring into proportional segments.
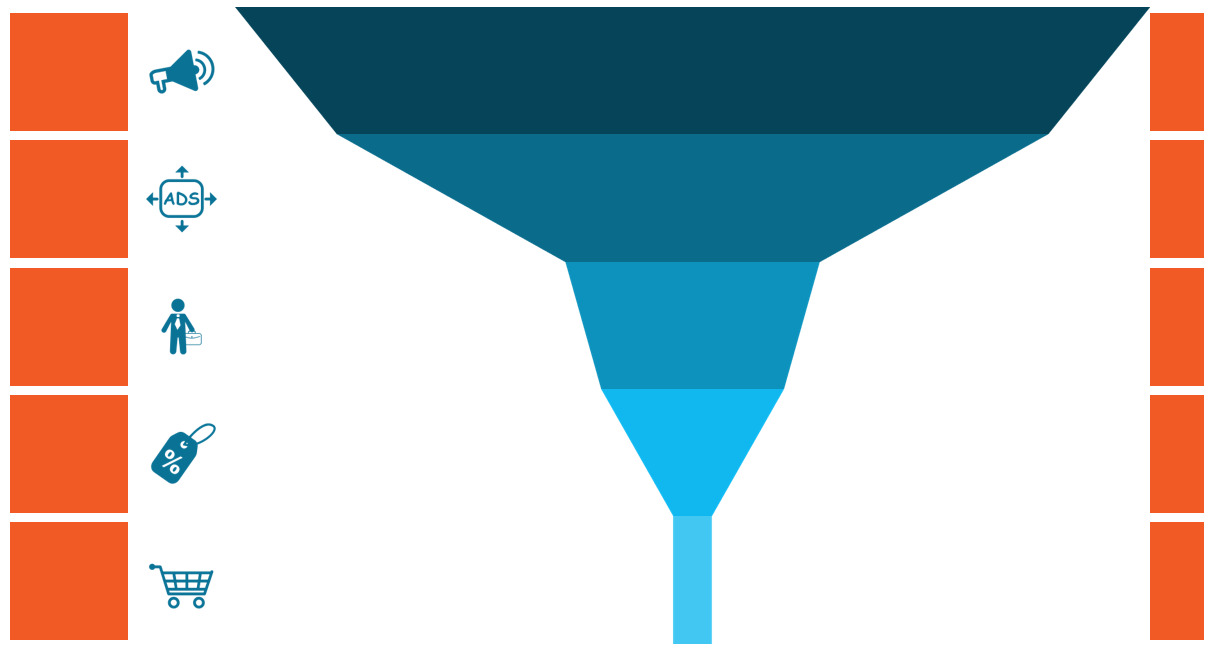
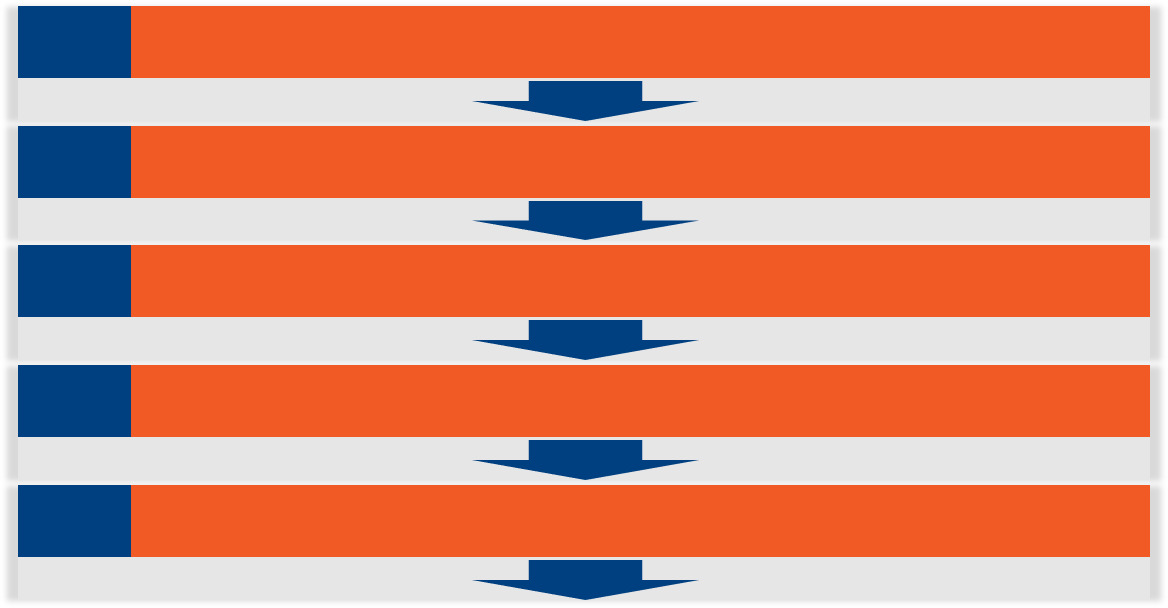
AGENDAS
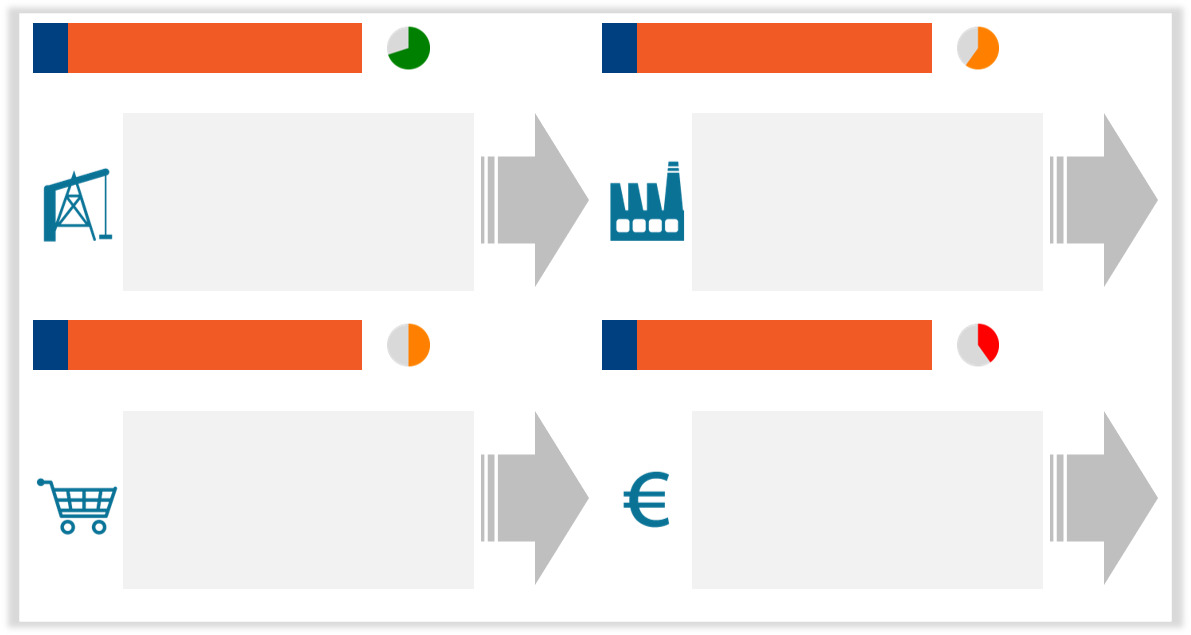
Funnel charts are often used to represent stages in a sales process and show the amount of potential revenue for each stage.
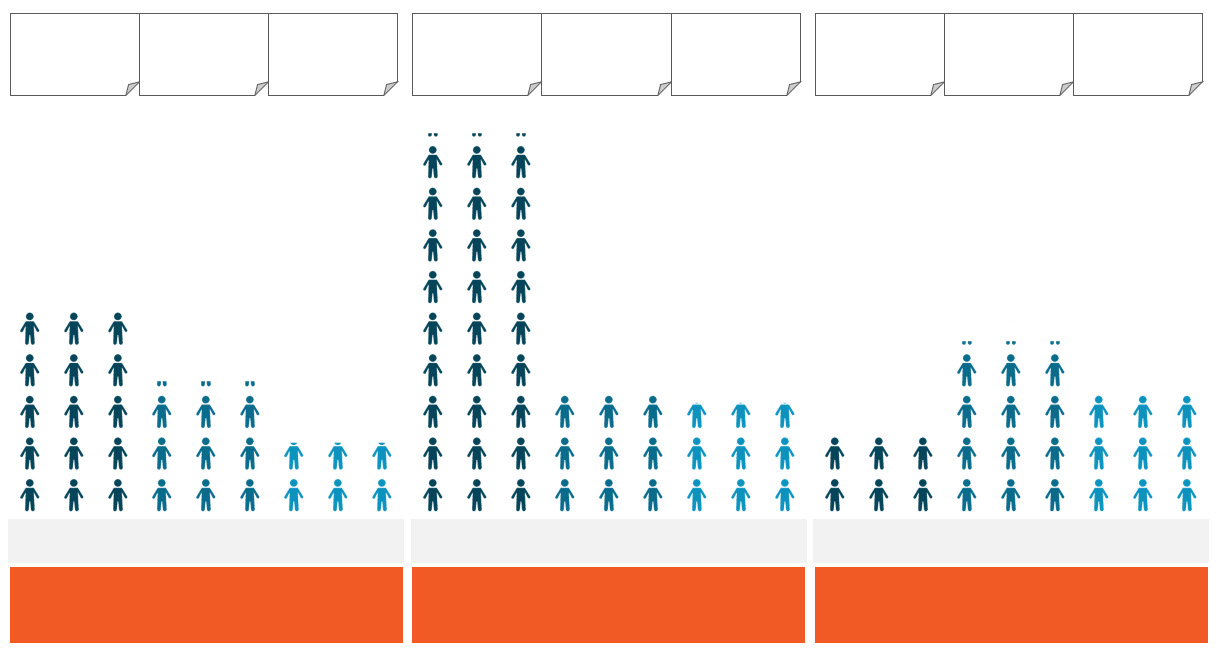
SMART ARTS
Funnel charts are often used to represent stages in a sales process and show the amount of potential revenue for each stage.
System requirement
Chart | BI runs on:
Microsoft Office 2013, 2016 and 365 for Windows, with at least PowerPoint and Excel installed.
Processors (CPUs):
Processors (CPUs): Multi-core x64 compatible processors
Memory:
8 GB minimum
Disk space:
500 MB total required to install